


What Is a Gantt Chart? How Agencies Use Them for Project Tracking
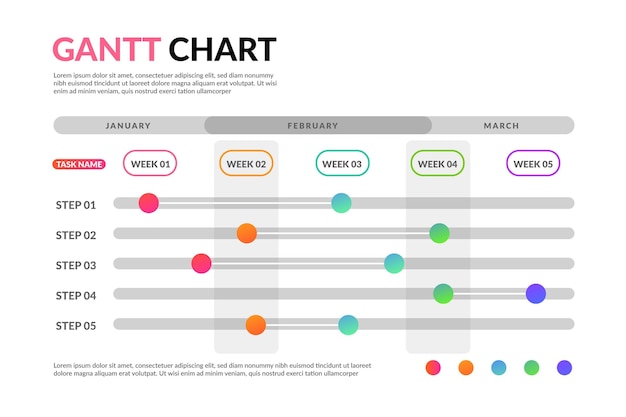
A Gantt chart is a bar chart that lays out the project schedule. It's important because it can help you visualize what needs to be done and what dependencies there are between various aspects of your project.
In this blog post, we'll go over what a gantt chart is and what makes them so significant!
Gantt Chart:
A gantt chart is an effective way of laying out what needs to be done in your project.
It's used for visualizing what tasks depend on what other tasks and how long each task takes to complete (the length of time).
They can also help you visualize when milestones will happen, or even if there are certain things that need to take place before the next thing.
The bars represent start and end dates, while the top bar represents what milestone has been reached at a given date. Additionally, it shows dependencies between tasks so you know what comes first!
Significance of Gantt charts:
1) Helps in creating a project plan:
A gantt chart can help you create your project plan by laying out what tasks need to be done and when.
It also shows dependencies between tasks so you know what comes first! This is very helpful in preventing overlap or missed deadlines.
Creating a gantt chart is the first step of any project management software because it gives you an overview of what the project will entail.
From there, you can begin to populate the details of each task and assign them to team members.
This is a much more effective way of managing projects than trying to remember everything in your head!
2) Shows progress at a glance.
Gantt charts also help you see how the project is progressing at a glance.
This is helpful for identifying if any tasks are taking longer than expected and need to be reassigned or rescheduled.
It can also help you catch potential problems early on so that they can be fixed before they become bigger issues.
The visual representation makes it easy to spot trends and changes in the project schedule. This allows you to course correct as needed so that your project stays on track.
3) Helps visualize what needs to be done.
A gantt chart is an effective method of displaying what has been completed and what hasn't.
It displays when tasks were introduced or completed in project management software so that the entire team knows what they should have finished by now!
Being able to see what's been worked on at any given time helps prevent overlap in work being done as well as missed deadlines.
It also allows teammates to coordinate with each other more effectively since everyone knows what still needs to get done and who can do it next!
4) Helps determine what still needs to get done.
A gantt chart can help you see what work is left in a project and what order it should be completed by.
It's an effective way of determining the next step by seeing what tasks have been finished or due soon!
You can also use this information as a guide for future projects that need to be prioritized.
This ensures your team isn't wasting time on things that aren't important while neglecting other aspects of the project which are more pressing!
5) Helps manage what's most important.
Gantt charts can also help you prioritize what needs to be done first by determining what is the most pressing task at any given time.
This allows for an efficient use of resources and minimum amount of wasted effort!
Regardless of whether it's a business project or personal life, gantt charts are incredibly helpful in laying out what has been completed and what still needs to get done.
Having everything laid out visually makes it easy to see how the team is doing with their tasks as well as where they might need extra support from others on the team!
It's an effective way of keeping everyone on track so that deadlines aren't missed and progress continues moving forward smoothly.
6) Helps with risk assessment.
A gantt chart can also help in assessing risks for a project. This is done by identifying what tasks are more complex and might have a higher chance of failure.

You can then take steps to mitigate those risks by creating backup plans or assigning extra resources to that task!
7) Shows dependencies between tasks.
Ghantt charts are also helpful in determining the dependencies between tasks. This is done by identifying what task needs to be completed first in order for the next one to start.
It's a great way of preventing overlap or missed deadlines! Creating a gantt chart is the first step of any project management software because it gives you an overview of what the project will entail.
From there, you can begin to populate the details of each task and assign them to team members.
8) Helps with task management.
Once you have populated the gantt chart, it can be used as a tool for managing tasks.
This is done by identifying what team member is assigned to what task and when it needs to be completed.
You can also use this information to create reports which will give an overview of how the project is going!
Reports can be exported into different formats like PDF or Excel so that they can easily be shared with others on the team!
Gantt charts are essential for all types of projects because they help visualize what still needs to get done and when it needs to be done by.
Components of a Gantt Chart:
- Milestones:
A milestone is an important event or task in a project.
It can be something that needs to be completed in order for the project to be considered successful or it could simply be a checkpoint to make sure everything is on track.
Milestones are usually represented as bars on a gantt chart with the length of the bar reflecting how much time is allotted for it.
- Tasks:
A task is a single unit of work that needs to be completed in order for the project to move forward.
Tasks are what make up your gantt chart and they help you visualize what still needs to get done as well as what has been accomplished! .Task represent what needs to get done in order to reach a milestone.
They can be broken down into smaller sub-tasks if needed and have specific start and end dates associated with them.
- Dependencies:
Dependencies are what make gantt charts so powerful! They are what show the relationship between different tasks in a project.
Dependencies between tasks show what needs to happen before another task can begin.
Milestones are important events or goals that need to be reached in a project. They can be represented by either text or symbols on a gantt chart.
- Durations:
Durations are the amount of time that is allotted for a task. They are usually represented on a gantt chart as either days, weeks, or months.

Another way gantt charts show progress towards milestones is through durations. This represents the amount of time left until completion for any given task if it's worked on constantly without breaks during this period of time!
- Bars:
Bars are what make up the visual construction of a gantt chart. They visually show what has been accomplished as well as what still needs to get done.
The length of each bar is representative of how much time is allotted for that specific task or milestone!
When tasks and milestones both have bars on them, they represent the relationship between them in terms of what must be completed before another can begin!
Bars on a gantt chart represent each task and how much time is needed to complete it.
Completed tasks are usually shown in green, upcoming tasks are blue, and past due tasks are red.
- Labels:
Labels represent what each bar on a gantt chart represents and can be found along the top or bottom of any given bar.
Labels on a gantt chart show what each task is, what it's for, and when it should be completed by.
They help to explain what the bars stand for so that team members can understand what they're looking at without needing extra time or research!
Gantt charts are an easy way to make sure everyone involved in a project is on the same page, what has been completed and what still needs to get done.
They're also great for keeping track of what's getting done at what time so that deadlines aren't missed! .
It's important to understand how gantt charts work so that you can use them effectively in your next project!


